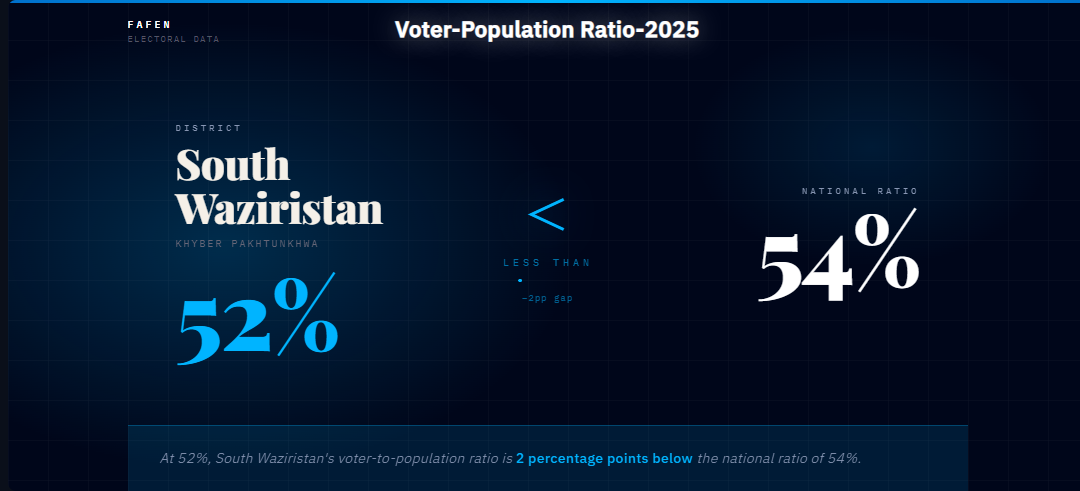
South Waziristan’s voter registration rate stands at 52% of its estimated 2025 population — two percentage points below the national ratio of 54%.
Methodology
These figures are drawn from district-wise electoral roll statistics released by the Election Commission of Pakistan (ECP) on 30 December 2025. They are cross-referenced against population estimates derived from the 2023 Digital Census. The 2025 population estimate applies the 4.7% inter-censal annual growth rate to South Waziristan’s census base population of 888,675, yielding an estimated 2025 population of 974,173. Registration rates are calculated by dividing the number of registered voters by this estimated population.
Voter registration in South Waziristan
The district has 503,181 registered voters — 294,568 males (58.5%) and 208,613 females (41.5%). Among males, 58% of the estimated population is registered; among females, 44%. South Waziristan ranks 85th out of 136 districts nationally by population size and is represented by one Member of the National Assembly.
By voter registration rate, South Waziristan ranks 73rd nationally and 27th of 35 within Khyber Pakhtunkhwa.
Why registration trails the national ratio
An acute gender gap is the primary driver of South Waziristan’s below-average registration rate. Female voters account for 41.5% of the registered electorate — 85,955 fewer than male voters. Women’s registration stands at 44% of the estimated female population, against a male rate of 58%.
Unlike the census enumeration effect that explains the below-average ratio in major cities, South Waziristan’s gap reflects genuine non-registration. Women counted in the 2023 census as residents of South Waziristan are not correspondingly represented on the electoral roll.
Restricted mobility, lower female CNIC penetration, and social constraints on civic participation are the principal structural barriers. Mobile NADRA units and sustained ECP outreach through community networks in South Waziristan are essential to reduce this gap before the next general elections.
This post is part of FAFEN’s series on voter vs population ratio. Read more of this series here.